This is the first post in a series of posts about boosting performance in the main Django application for the Norwegian Trekking Association (DNT). The application is scheduled to serve all of DNTs 200+ official web sites with a total of 1.5 million monthly page views by the end of 2015.
Sherpa is a fairly typical Django application. It uses Django 1.7 served through Gunicorn 1.8 via Nginx 1.9 using memcachd 1.4 for caching and Postgres 9.3 with Postgis 2.1 as its main database. I will try to get a another post out outlining the technical details of our production setup soon.
Step 1 - Gathering Data
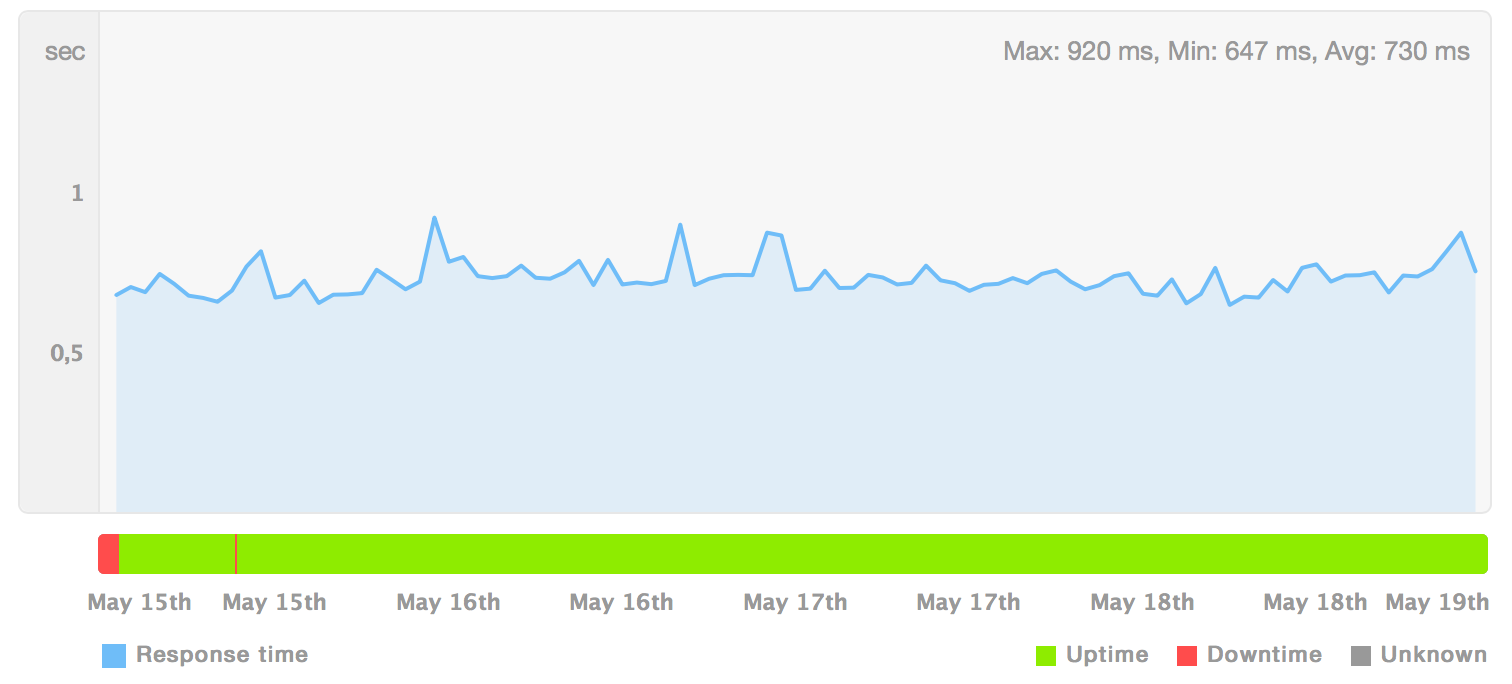
We have been measuring the response time of some key pages through our Pingdom monitoring checks for years, and they all yielded the same average of 730ms (originating from Europe since our servers are located in the eu-west-1 aws region).

Other than that we had fairly little data to work with so we decided to log all
Postgres queries longer than 300 ms over the weekend using the
log_min_duration_statement
method as suggested in this Postgres wiki
page on logging
difficult queries. Update: We later learned that our configuration was not
entirely correct, and subsequently all queries were logged. 😁 Oops!
Step 2 - Analyze
When we returned to work next Monday we had 10 GB of query logs to sift through. 😥. A few days later the log file had doubled in size! Postgres System Impact report (pgsi) to the rescue!
perl pgsi.pl --file=postgresql-head.log > pg_analyze.html
Now we had a nicely formatted html page with all the different queries ordered by type (SELECT, INSERT, UPDATE, etc) and system impact. The first entry immediately stood out as a big surprise! 😮
System Impact:    3.43
Mean Duration:    9.69 ms
Median Duration:  5.34 ms
Total Count:      624439
Mean Interval:    282.11 ms
Std. Deviation:   208.81 ms

SELECT postgis_lib_version()
The query with the most system impact of all the logged queries was a simple call to retrieve the version of the installed PostGIS library. How could this be? The total count for this query indicated that it had to be executed for each request to the application.
Searching the django/django repository on GitHub returned one result for a test, and one in what appeared to be the PostGIS driver for Django / GeoDjango – no issues 😕.
def postgis_lib_version(self):
    "Returns the version number of the PostGIS library used with PostgreSQL."
    return self._get_postgis_func('postgis_lib_version')
Upon further inspection of the
driver
we reviled the following function call chain: postgis_lib_version() <=
postgis_version_tuple() <= spatial_version(). In the spatial_version()
function definition there where this comment:
Trying to get the PostGIS version because the function signatures will depend on the version used. The cost here is a database query to determine the version, which can be mitigated by setting
POSTGIS_VERSIONwith a 3-tuple comprising user-supplied values for the major, minor, and subminor revision of PostGIS.
And there we had it! For each connection to the Postgres database Django’s
PostGIS driver would try to determine what version of PostGIS was installed in
order for it to communicate correctly. This is done by executing the
postgis_lib_version function unless POSTGIS_VERSION setting is set.
Step 3 - Act
We quickly added POSTGIS_VERSION based on an environment variable to our
Django settings, and deployed to production.
if 'POSTGIS_VERSION' in os.environ:
    POSTGIS_VERSION = os.environ['POSTGIS_VERSION']
Step 4 - Profit
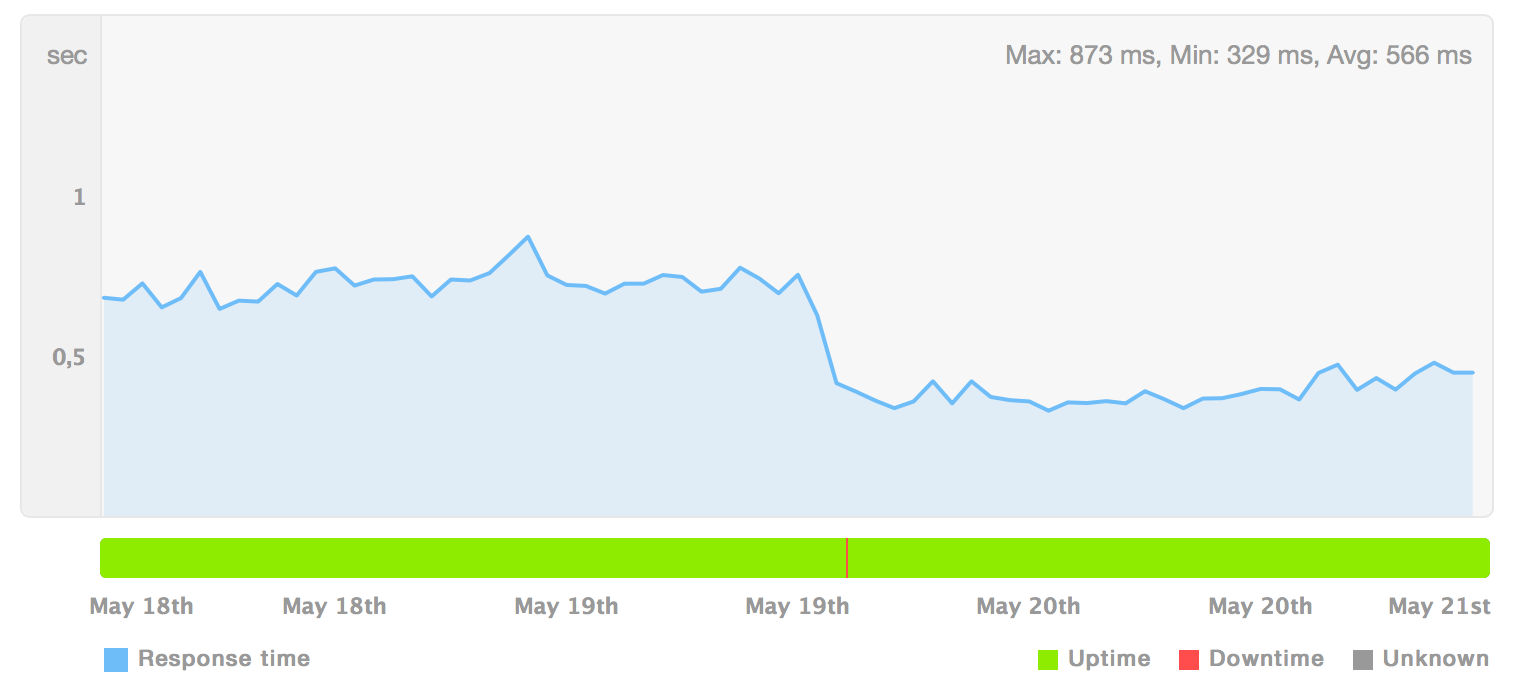
Response time immediately dropped by 45%, from 730ms to 400ms. We would never have expected these two lines of code to impact the overall performance of the system in such a way!

Comments
If you have any questions or other feedback to the article, please post them in the comment section bellow and I promise to read them and respond to you on a regular basis.